It turns out that there is a waveform menu:
 The "Get Waveform Components" element at the upper left corner of the menu in this image allows you to unbundle information from the waveform data type much like unbundling from a cluster. When first placed on the block diagram it will look like the following (with a waveform wired in):
The Y output is the desired floating point array. However, if the time information for the waveform is desirable, you must expand this element at the top in an upward direction. This is done by hovering over the top edge until the cursor indicates you can drag to expand. When this is done, you can expand two elements above the Y as shown below:

Now the initial time and the delta time per point are available. The waveform type contains evenly spaced data points, so a single dt point is all that is available.
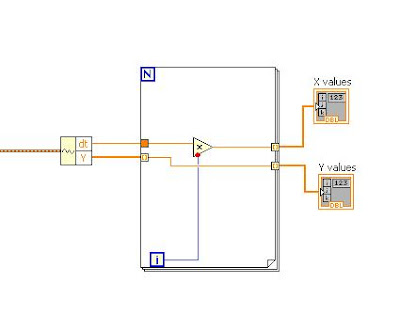
At a minimum, using the Y terminal provides an indexable array. To produce X-Y plots, you can run the Y array in autoindexing fashion, through a for loop. Use the index terminal inside the for loop and multiply its value by dt for each iteration. This can be wired to an autoindexing output to generate an array of X values corresponding to Y values:
 Rather than wire the corresponding X and Y arrays to indicator terminals, you can continue to operate on the arrays in whatever manner is necessary for your application. These two arrays can be bundled into a cluster and wired to the terminal for an XY Graph Indicator. They can also be operated upon with the usual index array and array subset VIs under the Array menu.
1 comment:
We are students working at IIIT-D, India on SASEBO-W board for side channel attacks on smart cards. We are using DPO4104B Tektronix oscilloscope for our analysis and we are using VISA to communicate between the PC(running windows 7 ) and the Oscilloscope. We were looking for an interface and data acquisition platform.We actually want to caputure data on one channel when the signal on the other channel reaches a particular level. We would be highly grateful if you could provide us some help at amanjha444@gmail.com
Post a Comment